عضویت
عضویت  ورود اعضا
 راهنمای خرید


Chemical Concentration Control0 pages
Chemical
Application Data Sheet
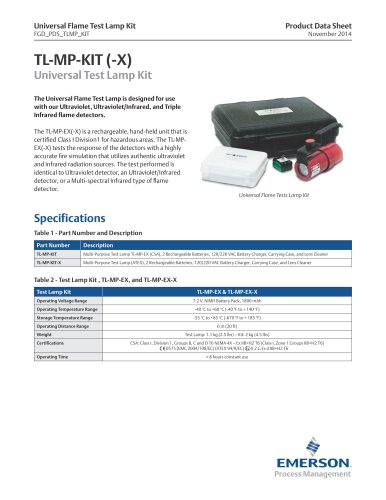
Chemical Concentration Control
Background
Numerous industrial applications require solutions of a specific
chemical strength. Such specific concentrations are achieved by
mixing a full strength solution with water in the desired proportions.
Flow-paced control is used as a crude control in this operation, and a
conductivity measurement is used for trim control.
Controlling Concentration
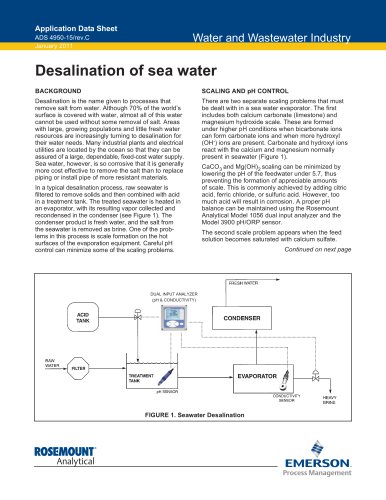
The full-strength solution and water are mixed in two stages
illustrated in Figure 1:
1.t A flow ratio controller on a mixing tank is set for a given flow
rate of the full strength solution and a proportional flow
rate of the water. The flow-ratio controller is set to produce
a concentration slightly weaker than that which is desired.
The flow-ratio controller should also be capable of warning
operators when no liquid is actually flowing in the full strength
solution and the water lines.
2.t A control valve receiving input from a conductivity analyzer
functions as a “trim control”. It adds a small amount of full
strength solution to the mixing tank to produce the exact
concentration desired.
For example, in making a 35 % caustic solution from a large bulk
caustic supply at 50 %, the flow ratio controller is adjusted to make
a 30 % solution and the conductivity signal is used to add additional
caustic to make the 35 % solution.
Conductivity is an economical and widely used index of
concentration for most acid, base, and salt solutions. It is important
to determine the range of possible concentrations at a given
location in order to interpret conductivity measurements. A good
conductivity application will have a significant change in reading
over the possible concentration range and only one concentration
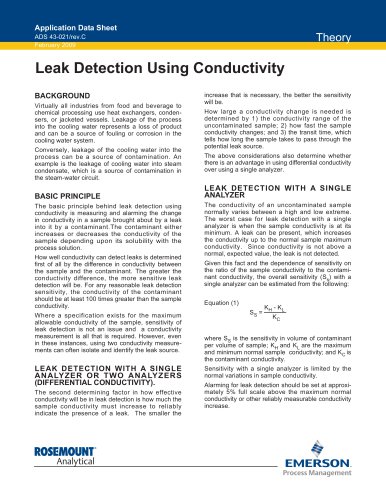
value for any given conductivity reading. Conductivity tends
to increase with concentration for dilute solutions, however
concentrated solutions can have very different properties. Caustic
(NaOH) is an example in which conductivity actually drops with
increased concentration over 15 % (see Figure 2).
Conductivity graphs, such as Figure 2 and the many others
included in Emerson Process Management’s Conductance Data for
Commonly Used Chemicals, usually apply to pure mixtures of water
and the indicated chemical. Although the conductivity of a mixture
is usually close to the sum of the conductivity of its components, the
presence of significant amounts of certain substances (iron, copper,
and some sugars, for example) can actually lower the measured
conductivity.
Conductivity data is temperature dependent and is frequently stated
at a reference temperature of 25 °C (77 °F). Temperature correction
is specific to the application and can be very important when
extreme and/or variable temperature is likely.
Instrumentation
Emerson Process Management’s Liquid Division has a complete line
of electrodeless (toroidal) conductivity sensors that are especially
suitable for monitoring chemical concentration. The most popular
and versatile sensor is the 228 insertion/submersion sensor, which
can also be used in a high pressure retraction assembly. Sensors
having other installation options include the large bore 226 sensors,
sanitary 225, and the flow-through 242. Consult the appropriate
Product Data Sheet for complete details.
Compatible Toroidal Conductivity analyzers include the 5081-T
and 1066 HART and FOUNDATION™ Fieldbus Transmitters, the 1056
Conductivity Analyzer, and the 56 Conductivity Analyzer/Controller.
Each of these models has been specifically designed for measuring
percent.