عضویت
عضویت  ورود اعضا
 راهنمای خرید


Sourcery Analyzer0 pages
Mentor Embedded
Sourcery Analyzer
D a t a s h e e t
product features:
■■ Dynamic system analysis views
Easily create, modify, and reorganize
views in order to form and test
theories about the data
■■ Large log file capability
Proven capacity to handle multigigabyte datasets
■■ Capture system level behavior
View the activity of processes and
tasks, resources, and cores over time
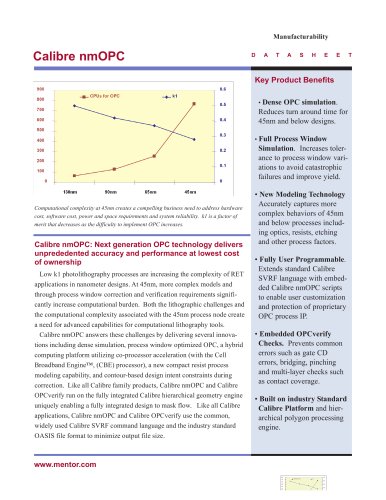
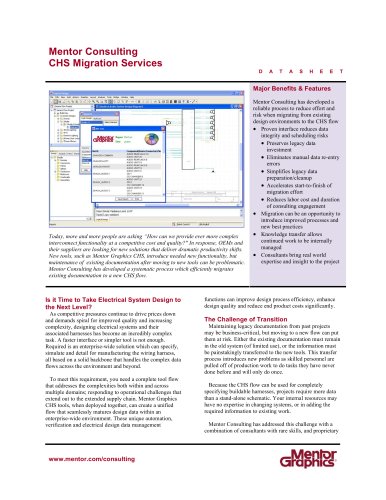
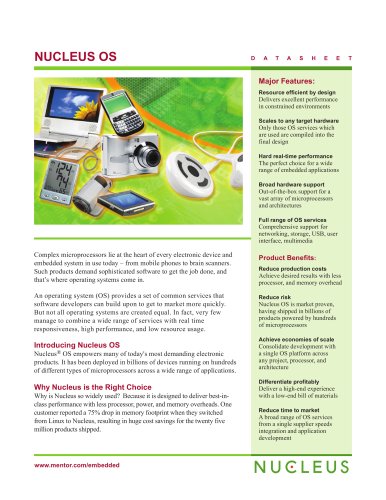
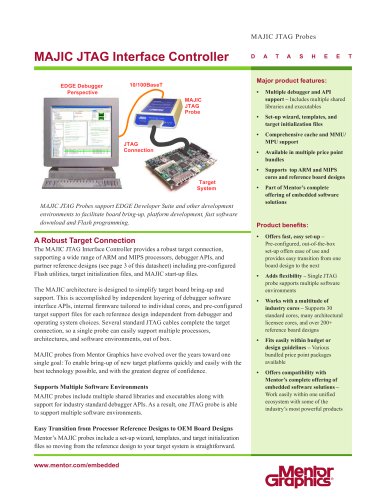
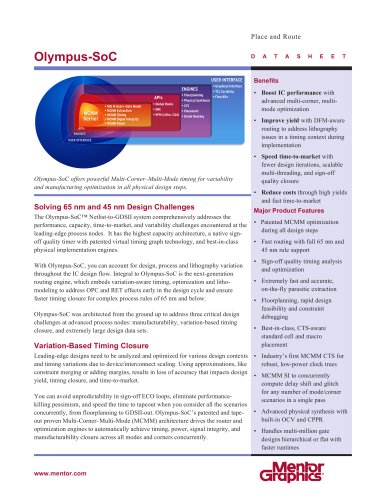
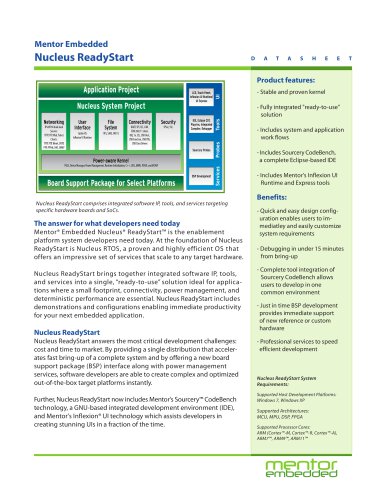
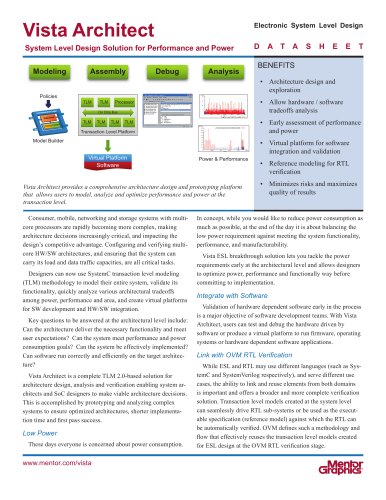
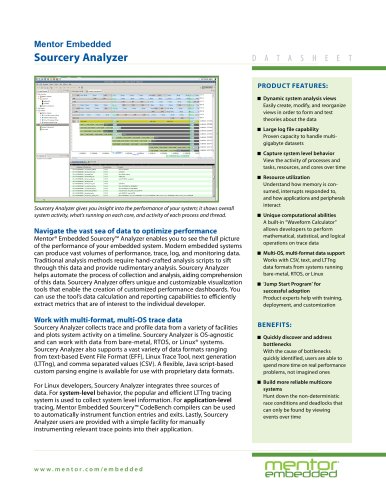
Sourcery Analyzer gives you insight into the performance of your system; it shows overall
system activity, what’s running on each core, and activity of each process and thread.
Navigate the vast sea of data to optimize performance
Mentor® Embedded Sourcery™ Analyzer enables you to see the full picture
of the performance of your embedded system. Modern embedded systems
can produce vast volumes of performance, trace, log, and monitoring data.
Traditional analysis methods require hand-crafted analysis scripts to sift
through this data and provide rudimentary analysis. Sourcery Analyzer
helps automate the process of collection and analysis, aiding comprehension
of this data. Sourcery Analyzer offers unique and customizable visualization
tools that enable the creation of customized performance dashboards. You
can use the tool’s data calculation and reporting capabilities to efficiently
extract metrics that are of interest to the individual developer.
Work with multi-format, multi-OS trace data
Sourcery Analyzer collects trace and profile data from a variety of facilities
and plots system activity on a timeline. Sourcery Analyzer is OS-agnostic
and can work with data from bare-metal, RTOS, or Linux® systems.
Sourcery Analyzer also supports a vast variety of data formats ranging
from text-based Event File Format (EFF), Linux Trace Tool, next generation
(LTTng), and comma separated values (CSV). A flexible, Java script-based
custom parsing engine is available for use with proprietary data formats.
For Linux developers, Sourcery Analyzer integrates three sources of
data. For system-level behavior, the popular and efficient LTTng tracing
system is used to collect system level information. For application-level
tracing, Mentor Embedded Sourcery™ CodeBench compilers can be used
to automatically instrument function entries and exits. Lastly, Sourcery
Analyzer users are provided with a simple facility for manually
instrumenting relevant trace points into their application.
w w w. m e nto r. co m /e m b e d d e d
■■ Resource utilization
Understand how memory is consumed, interrupts responded to,
and how applications and peripherals
interact
■■ Unique computational abilities
A built-in “Waveform Calculator”
allows developers to perform
mathematical, statistical, and logical
operations on trace data
■■ Multi-OS, multi-format data support
Works with CSV, text, and LTTng
data formats from systems running
bare-metal, RTOS, or Linux
■■ ‘Jump Start Program’ for
successful adoption
Product experts help with training,
deployment, and customization
benefits:
■■ Quickly discover and address
bottlenecks
With the cause of bottlenecks
quickly identified, users are able to
spend more time on real performance
problems, not imagined ones
■■ Build more reliable multicore
systems
Hunt down the non-deterministic
race conditions and deadlocks that
can only be found by viewing
events over time