عضویت
عضویت  ورود اعضا
 راهنمای خرید


iBALANCE Engine Monitoring and Diagnostics System0 pages

Dresser-Rand®
Enginuity iBALANCE
Engine Monitoring and Diagnostics System
Our leadership in
technology, business
processes and operational
excellence creates products
and services capable of
achieving the highest
level of client satisfaction
and long-term loyalty
throughout the global
energy industry.
iBALANCE™ g2 System
The iBALANCE g2 system is one of the most advanced real-time, continuous
engine monitoring systems in the market today. The system was specifically
designed for large-bore, two- and four-stroke natural gas reciprocating engines. The
iBALANCE g2 system provides crucial performance data which allows operators to
make intelligent decisions concerning overall engine performance, maintenance,
troubleshooting and planned downtime. A single iBALANCE g2 system can monitor
up to 20 power cylinders.
EE
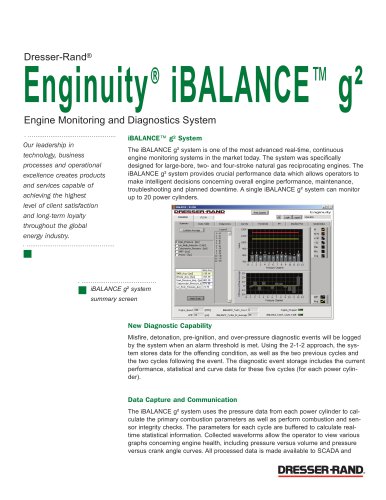
iBALANCE g2 system
summary screen
DRESSER -Ft AND
: Screen
r™i i w" i w"i
| Cylindet Average |
3c_Psaf!_Pre«sure - [CAD]
presswn Pressure -[psi]
[hp]
IMEP_Avg ■ [p-si] 135-14
IPower_Avg - [hp] 157.79
Peak_Pre;5ure_Awr| ■ (pa 802.30
Corripre5;iori_Pre;5"jie_4 571.30
Loc Jeak_PTe«ure_Avq -| 19.79
5D N
Pressure Channel
Engine_5peed 200 [ftPM] iBALANCE_Tooth_C[iunl □
AMP 10 [psi] iBALANCE_Cydes_In_Avi:i«jge 55
Engine _'jt'>cs-e J -
iBALANCE_Tooth_Count_Fault E
New Diagnostic Capability
Misfire, detonation, pre-ignition, and over-pressure diagnostic events will be logged
by the system when an alarm threshold is met. Using the 2-1-2 approach, the sys-
tem stores data for the offending condition, as well as the two previous cycles and
the two cycles following the event. The diagnostic event storage includes the current
performance, statistical and curve data for these five cycles (for each power cylin-
der).
Data Capture and Communication
The iBALANCE g2 system uses the pressure data from each power cylinder to cal-
culate the primary combustion parameters as well as perform combustion and sen-
sor integrity checks. The parameters for each cycle are buffered to calculate real-
time statistical information. Collected waveforms allow the operator to view various
graphs concerning engine health, including pressure versus volume and pressure
versus crank angle curves. All processed data is made available to SCADA and
DRESSER-RAND.
"