عضویت
عضویت  ورود اعضا
 راهنمای خرید


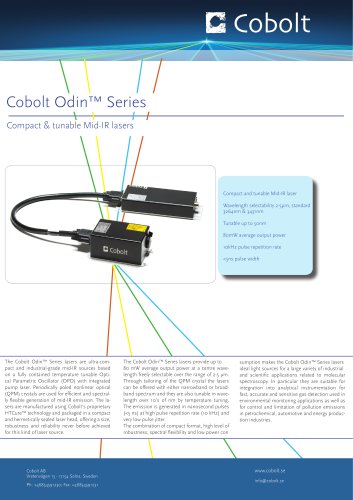
Cobolt Odin? Series lasers for gas sensing0 pages
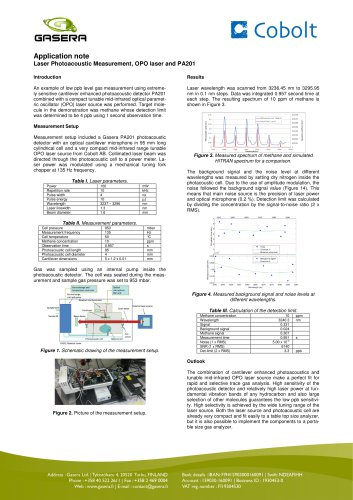
Application note
Laser Photoacoustic Measurement, OPO laser and PA201
Introduction
Results
An example of low ppb level gas measurement using extremely sensitive cantilever enhanced photoacoustic detector PA201
combined with a compact tunable mid-infrared optical parametric oscillator (OPO) laser source was performed. Target molecule in the demonstration was methane whose detection limit
was determined to be 4 ppb using 1 second observation time.
Laser wavelength was scanned from 3236.45 nm to 3295.95
nm in 0.1 nm steps. Data was integrated 0.957 second time at
each step. The resulting spectrum of 10 ppm of methane is
shown in Figure 3.
Measurement Setup
Measurement setup included a Gasera PA201 photoacoustic
detector with an optical cantilever microphone in 95 mm long
cylindrical cell and a very compact mid-infrared range tunable
OPO laser source from Cobolt AB. Collimated laser beam was
directed through the photoacoustic cell to a power meter. Laser power was modulated using a mechanical tuning fork
chopper at 135 Hz frequency.
Table I. Laser parameters.
Power
Repetition rate
Pulse width
Pulse energy
Wavelength
Laser linewidth
Beam diameter
100
10
4
10
3237 – 3296
1.3
1.6
mW
kHz
ns
µJ
nm
nm
mm
Figure 3. Measured spectrum of methane and simulated
HITRAN spectrum for a comparison.
The background signal and the noise level at different
wavelengths was measured by setting dry nitrogen inside the
photacoustic cell. Due to the use of amplitude modulation, the
noise followed the background signal value (Figure 14). This
means that main noise source is the precision of laser power
and optical microphone (0.2 %). Detection limit was calculated
by dividing the concentration by the signal-to-noise ratio (2 x
RMS).
Table II. Measurement parameters.
Cell pressure
Measurement frequency
Cell temperature
Methane concentration
Observation time
Photoacoustic cell length
Photoacoustic cell diameter
Cantilever dimensions
953
135
50
10
0.957
95
4
5 x 1.2 x 0.01
mbar
Hz
°C
ppm
s
mm
mm
mm
Gas was sampled using an internal pump inside the
photoacoustic detector. The cell was sealed during the measurement and sample gas pressure was set to 953 mbar.
Figure 4. Measured background signal and noise levels at
different wavelengths.
Table III. Calculation of the detection limit.
Figure 1. Schematic drawing of the measurement setup.
Methane concentration
Wavelength
Signal
Background signal
Methane signal
Measurement time
Noise (1 x RMS)
SNR (1 x RMS)
Det-limit (2 x RMS)
10
3240.3
0.331
0.024
0.307
0,951
5.00 x 10⁻⁵
6140
3.3
ppm
nm
s
ppb
Outlook
Figure 2. Picture of the measurement setup.
The combination of cantilever enhanced photoacoustics and
tunable mid-infrared OPO laser source make a perfect fit for
rapid and selective trace gas analysis. High sensitivity of the
photoacoustic detector and relatively high laser power at fundamental vibration bands of any hydrocarbon and also large
selection of other molecules guarantees the low ppb sensitivity. High selectivity is achieved by the wide tuning range of the
laser source. Both the laser source and photoacoustic cell are
already very compact and fit easily to a table top size analyzer,
but it is also possible to implement the components to a portable size gas analyzer.